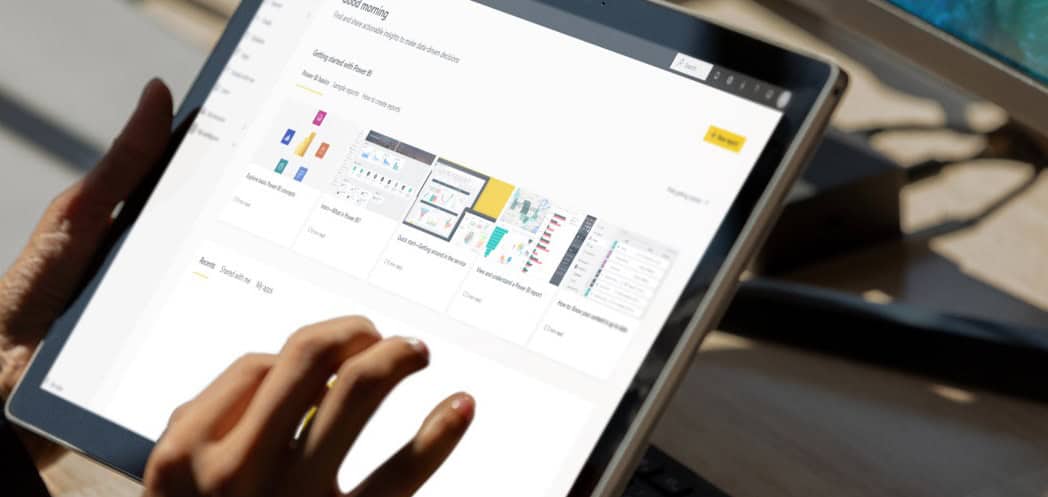
The modern business environment is unquestionably data-driven: being able to interpret and act on large amounts of data at speed can add a competitive edge to operations.
However, raw data without the right tools to process them can be overwhelming or easily misinterpreted. This is where Power BI, Microsoft’s business intelligence tool, comes in.
But what is Power BI and why are businesses embracing it?
Power BI: Data Visualisation For Business
In essence, Power BI is designed to turn raw data from various sources into coherent, visually immersive, and interactive insights. This process is typically known as data visualisation.
Data visualisation is highly valuable for business strategy. The ability to transform complex data into clear trends and actionable insights supports faster and smarter decision-making.
Visualisation can also be useful for revealing trends that might otherwise go unnoticed in a spreadsheet or when data exists in siloes. Bringing information together into appealing visuals can help organisations identify patterns, correlations, and insights.
While data visualisation tools have been used for years, Power BI is now accessible to organisations at all levels. This enables them to leverage data for better decision-making.
Benefits Of Power BI vs. Traditional Reporting Tools
Traditional reporting tools often rely on static information, with the need to then create reports manually. These are often time-consuming to produce, only reflective of a certain period, and commonly difficult to update.
In contrast, Power BI offers dynamic and interactive dashboards that can be updated in real-time, ensuring that decision-makers have access to the latest insights.
Older tools also typically struggle with integrating data from multiple sources. In contrast, Power BI excels by consolidating data from various platforms – whether they are cloud-based or on-premises.
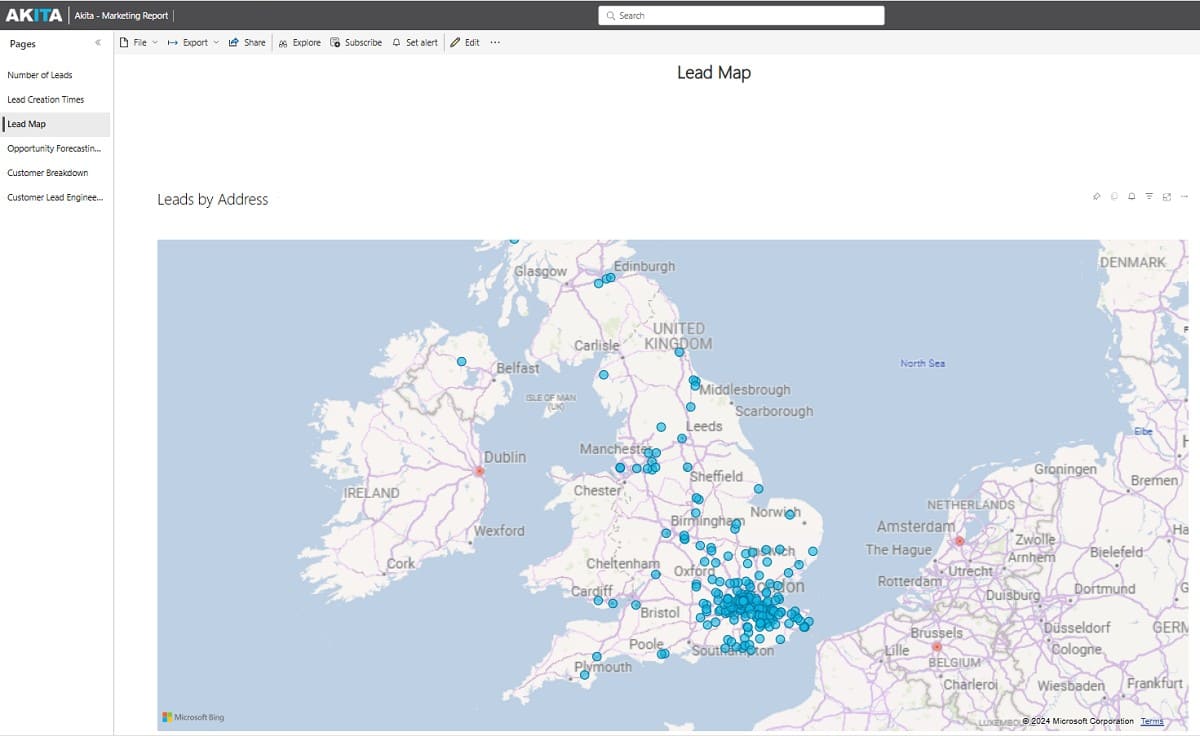
The platform’s ability to create rich visualisations such as charts, graphs, and maps far surpasses the capabilities of legacy systems. This interactivity allows users to dive deeper into the data, uncover trends, and make data-driven decisions more quickly and effectively.
Potential Uses of Power BI
Power BI’s versatility means it can be applied across various departments and job functions. Common uses include:
- Sales & Marketing: Track customer behaviour, analyse campaign performance, and monitor key sales metrics in real-time to optimise strategies and improve customer engagement.
- Finance: Create financial reports, balance sheets, and track KPIs like revenue, expenses, and profit margins, providing a clear view of financial health and facilitating better budgeting and forecasting.
- Operations: Monitor supply chain efficiency, inventory levels, and production processes, helping to identify bottlenecks and improve operational efficiency.
- Customer Service: Track customer satisfaction metrics, response times, and service requests to improve service quality and identify areas for enhancing customer support.
- Human Resources: Analyse employee performance, turnover rates, and recruitment metrics to make data-driven HR decisions that enhance workforce productivity and retention.
The Benefits of Power BI for SMEs
Small and medium-sized enterprises (SMEs) often face challenges when adopting complex business intelligence tools due to limited budgets and resources.
Power BI provides a solution that is both scalable and affordable. With its intuitive interface, non-technical users can create reports and analyse data, reducing the need for specialised IT support.
The ability to integrate with widely used tools like Excel also makes it more accessible to smaller businesses. SMEs can leverage existing data to produce meaningful insights without needing to invest in new systems.
Additionally, Power BI’s cost structure—offering both free and paid versions—means businesses can start with basic functionalities and upgrade as their needs grow.
Power BI can not only improve decision-making, therefore, but also provides a platform for data-driven strategies that allows smaller organisations to compete with much larger ones. Whether it’s tracking financial performance or analysing customer data, Power BI gives SMEs the tools they need to make smarter decisions without breaking the bank.
Power BI: Transforming Business Decision Making
For organisations of any size, Power BI offers a robust, scalable solution that transforms raw data into actionable insights, helping businesses thrive in today’s fast-paced market.
By leveraging Power BI’s advanced analytics and real-time reporting, organisations can stay competitive in an increasingly data-driven world. Whether you need insights into financial performance, sales trends, or operational efficiency, Power BI provides the tools to unlock your data’s full potential.
Ready to explore Microsoft Power BI? Get in touch with Akita:
Contact Us


